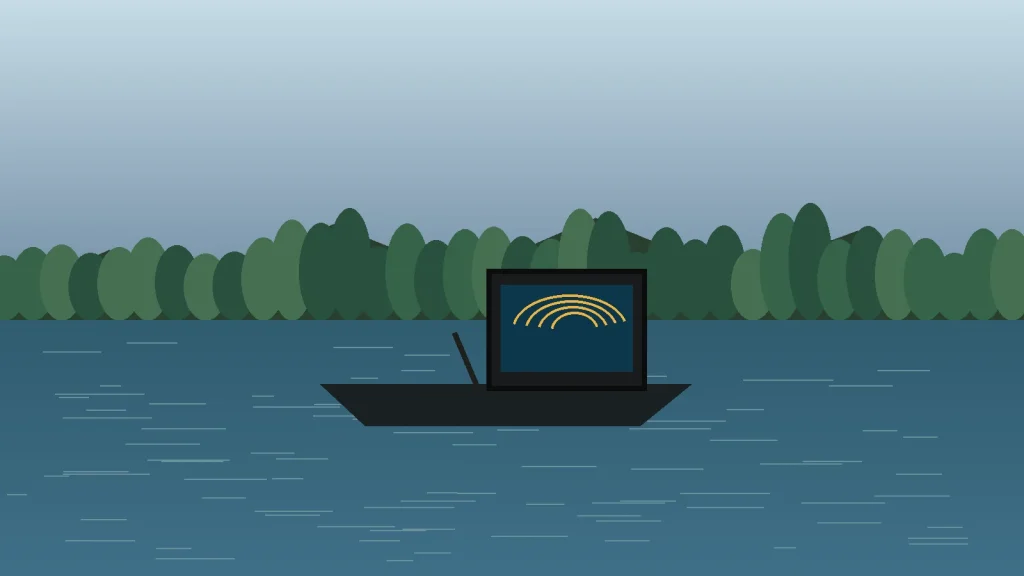
Learn how returns, acoustic shadows, range, frequency, speed, and transducer setup affect what bass, baitfish, brush, rock, and grass look like.
Quick answer: Read side imaging from the centerline outward. The center is the boat path and water column; the bottom spreads to the left and right. Bright returns are strong echoes from hard or upward-facing surfaces. Dark areas behind them are acoustic shadows. Bass usually appear as small bright marks with a separate shadow, but size and shape change with range, depth, frequency, boat speed, and fish position.
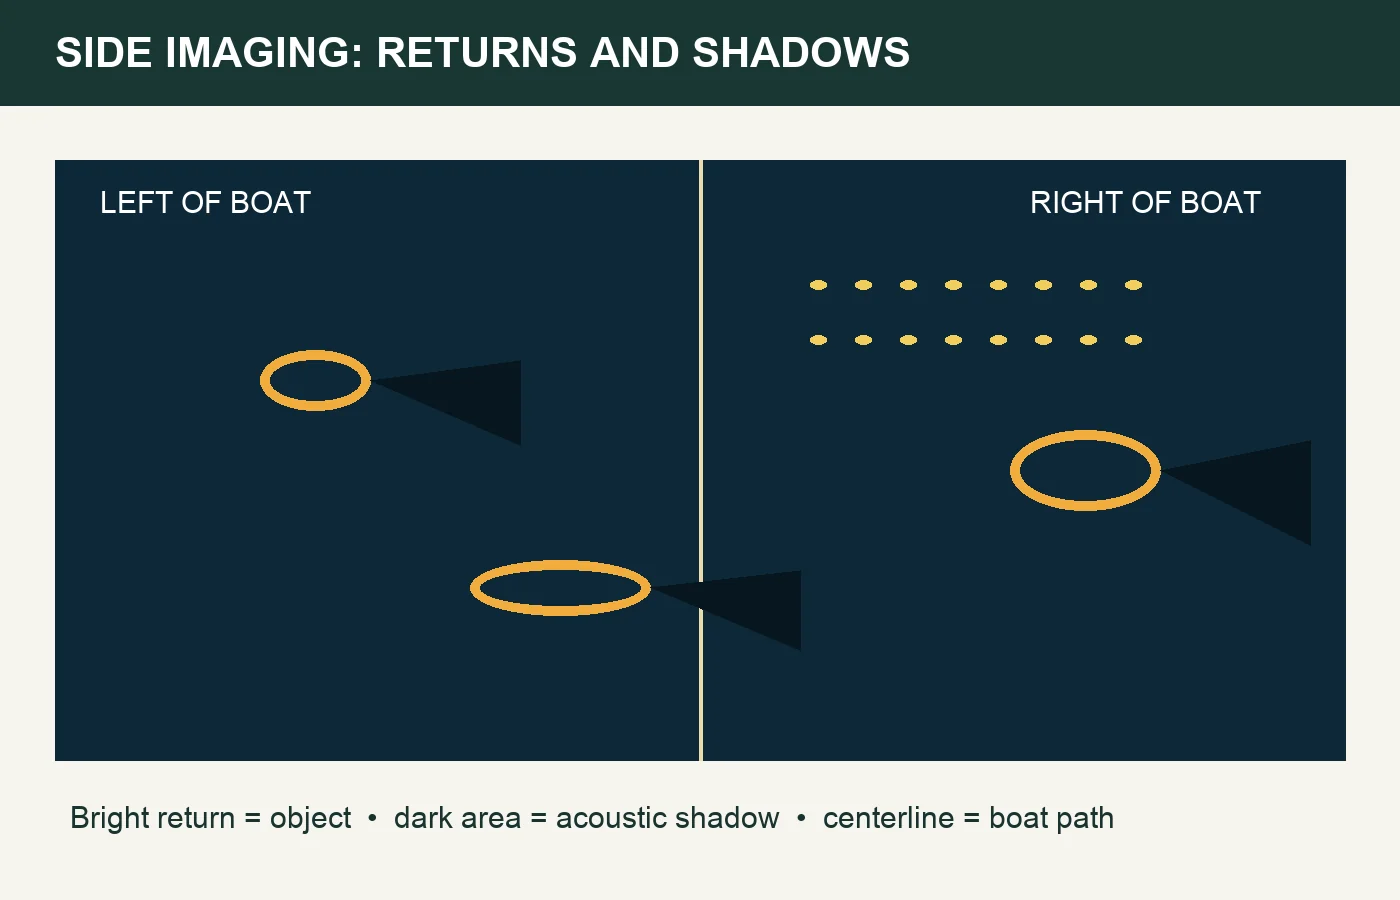
Reviewed: August 28, 2026 | Evidence: DOCUMENTED manufacturer operating principles plus EDITORIAL ASSESSMENT. The illustration below is educational—not a real sonar screenshot.
Side imaging is best used as a search tool. It scans a wide strip of water, helps separate rock from wood, shows the shape of brush and drop-offs, and lets you place a waypoint away from the boat. It does not identify species with certainty. Use it to find high-probability targets, then confirm them with a second pass, down imaging, 2D sonar, or a cast.
Orient the image before identifying anything
- Centerline: the narrow line running through the middle is the boat’s track.
- Dark center band: this represents the water column beneath the transducer, not a trench in the lake.
- Left and right bottom: the lake bottom is laid outward on each side.
- New information: appears at the top on many chart orientations and scrolls downward as the boat moves.
Confirm the orientation setting on your unit. Some displays can reverse colors, swap sides to correct installation, or change scroll direction. Read the manual before assuming a left-side return is physically left.
Returns and shadows: the two-part clue
A hard surface facing the transducer often appears bright because it returns more sound. Soft sediment can look darker. But palette, contrast, gain or sensitivity, and auto settings influence brightness, so brightness alone does not prove composition.
Acoustic shadows carry shape information. A standing tree may show a bright trunk and limbs followed by a long dark shadow. A low rock produces a shorter shadow. A fish suspended above bottom can show a bright dot separated from its shadow. The farther the shadow is from the object, the higher the object is likely to be above bottom—within the geometric limits of the view.
What bass can look like
Bass may appear as bright dots, short dashes, or small oval returns. They do not always form the classic arch associated with traditional 2D sonar because side imaging uses a thin beam and different display geometry. A separate shadow can make a fish easier to distinguish from bottom clutter.
Do not identify a species from one dot. Confidence improves when several clues agree:
- The marks have consistent fish-like size and shape.
- They are positioned beside cover, on a break, or around bait.
- Shadows show that the marks are above bottom.
- A repeat pass or another sonar view confirms the target.
- Your cast produces the expected species.
Recognizing common targets
| Target | Likely appearance | What to verify |
|---|---|---|
| Brush pile | Irregular bright limbs with complex shadow | Height, isolated fish marks, hard spot nearby |
| Laydown | Trunk and branching pattern extending from shore | Orientation, outside limbs, depth change |
| Rock pile | Strong angular returns and compact shadows | Whether rocks are isolated or part of a larger hard-bottom patch |
| Baitfish school | Cloud, ball, or loose cluster of small returns | Predator marks around or beneath the group |
| Grass edge | Textured band with a cleaner edge or holes | Points, inside turns, isolated clumps |
| Drop-off | Change in bottom brightness/texture and geometry | Hard spot, channel turn, cover on the break |
Side imaging settings for bass
Range
A useful starting range is roughly three to five times the water depth on each side, then narrower when you need target detail. Excessive range compresses fish and cover into fewer screen pixels. In ten feet of water, test 40 to 60 feet per side before scanning 120 feet just because the unit allows it.
Frequency
Higher imaging frequencies generally favor detail at shorter useful range; lower frequencies generally favor coverage and deeper or wider scanning. Available frequencies and brand names vary by transducer and unit. Select only a frequency the installed transducer supports.
Sensitivity or gain
Begin with auto or the manufacturer’s default. Increase until weak returns become visible, then reduce if speckle and bottom clutter hide shape. The goal is separation, not the brightest possible screen.
Contrast
Set contrast so returns and shadows remain distinct. Too much contrast can erase weak fish marks; too little makes bottom texture look flat.
Chart speed and boat speed
Match chart speed to movement so targets retain recognizable proportions. A steady idle commonly produces easier-to-read images than acceleration, sharp turns, or drifting sideways. On a kayak, keep the transducer moving straight. Pedal strokes, paddle correction, and yaw can distort the image.
A repeatable scanning workflow
- Idle or pedal a straight line at a steady slow speed.
- Set a realistic left/right range for depth and screen size.
- Keep one readable palette instead of changing colors every pass.
- Watch for a combination of structure, bait, and fish-like marks.
- Drop a waypoint on the target, not on the boat position.
- Turn well beyond the target so the return pass is straight.
- Scan from a different angle or reduce range for detail.
- Confirm with down imaging, 2D, or a cast.
Good transducer placement is a prerequisite. Aerated water, a tilted transducer, obstruction from the hull, or installation too close to a motor can create missing data and noise. For the broader installation, use the fish finder wiring and mounting guide.
Boat and kayak differences
A bass boat can hold a controlled idle but may lose clean water behind a stepped hull or at speed. A kayak moves slowly enough for excellent detail, yet yaw and side drift can bend straight structure on the display. Mount the transducer where both side beams clear the hull, pedal drive, rudder, and loaded gear.
Power planning also matters on small craft. The kayak fish finder battery runtime and wiring guide includes a calculator and fused-circuit diagram. If you are still selecting a display, compare the research-based kayak fish finder guide.
Mistakes that make side imaging harder
- Scanning too wide: small fish occupy too few pixels.
- Turning over the target: the image stretches and compresses.
- Changing several settings at once: you cannot tell which adjustment helped.
- Reading only bright returns: shadows often reveal height and form.
- Calling every mark a bass: side imaging finds targets, not certainty.
- Using a screenshot from another unit as a universal template: palette, frequency, range, depth, and screen size change appearance.
Practice drill
Scan an object you can verify: a public dock, bridge piling outside a restricted zone, isolated stump, or marked fish attractor. Pass it from two directions at the same speed and range. Change only one setting, save screenshots, and compare. This builds a personal visual library without pretending that a generated illustration is real sonar data.
Official documentation
- Humminbird manuals — confirm Side Imaging controls for the exact model and transducer.
- Garmin Support — search the installed chartplotter manual for SideVü setup and interpretation.
- Lowrance downloads and manuals — verify SideScan settings and transducer requirements.
Menus, frequencies, and automatic processing change by model and software version. The exact manual for the display and transducer controls.
About the author
Josh is the founder and editor of The Anglers Hub. This article explains documented sonar principles and an editorial scanning workflow. It does not present generated images as authentic sonar recordings.
Model-specific reading references
- Humminbird: movement and side imaging — explains why movement builds the image and gives its documented operating-speed guidance.
- Humminbird Side Imaging education — centerline, water column, bottom, and target examples.
- Garmin: Sonar Settings Explained — gain, scroll speed, defaults, and one-change-at-a-time troubleshooting.
- NOAA Ocean Exploration: side-scan sonar — professional context for return strength, shadows, and interpretation limits.
Editor Note
Gear mentions and recommendations are independently evaluated from specifications, public product information, pricing, use-case fit, and upgrade paths unless a specific article states direct product experience.
More From The Hub
Kayak Fish Finder Battery Runtime and Wiring Guide
Estimate fish finder battery runtime and build a safer kayak electronics circuit with correct voltage, usable capacity, fusing, wire, and connectors.
Read More
A Simple Freshwater Fishing Setup That Covers Most Trips
Build one versatile beginner freshwater spinning setup with the right rod, reel, line, lures, drag, knots, and pre-trip checklist.
Read More
Braided Line vs Fluorocarbon vs Mono: What to Spool First
Strength, stretch, visibility, and knot behavior—how to choose main line and leaders for your first serious setups.
Read More